Continuous Dashboard Delivery


About this Service
This project is designed for a skilled freelancer to build a complete and fully automated Continuous Integration/Continuous Deployment (CI/CD) pipeline for data visualization dashboards. The final deliverable will be a reusable, well-documented solution that transforms the process of creating and deploying dashboards from a manual task into an efficient, automated workflow.
Challenge:
Many businesses struggle with slow, manual processes for updating and deploying data dashboards. This leads to outdated information, human error, and a significant time sink for data analysts and developers. The goal of this project is to solve this by treating the dashboard as code, enabling seamless, automated updates with every change.
Project Phases and Deliverables:
- Phase 1: Preparation & Design (1 day): The freelancer will select the best tools for the job, focusing on popular, free, and open-source options. Recommended tools include Git/GitHub for version control, GitHub Actions for the CI/CD pipeline, a Python framework like Streamlit or Dash for the dashboard, and a cloud platform like Heroku or Vercel for deployment.
- Phase 2: Implementation (3-5 days):
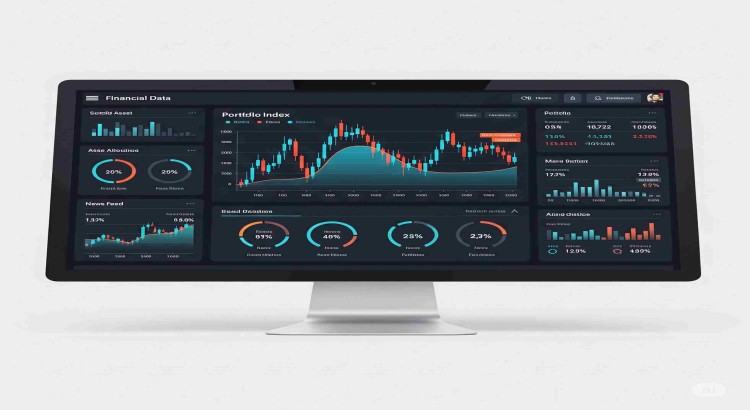
- Sample Dashboard: A functional Python dashboard will be created to visualize data from a sample CSV file or a public API. It must include at least three different chart types (e.g., line, bar, pie) to showcase a range of visualization capabilities.
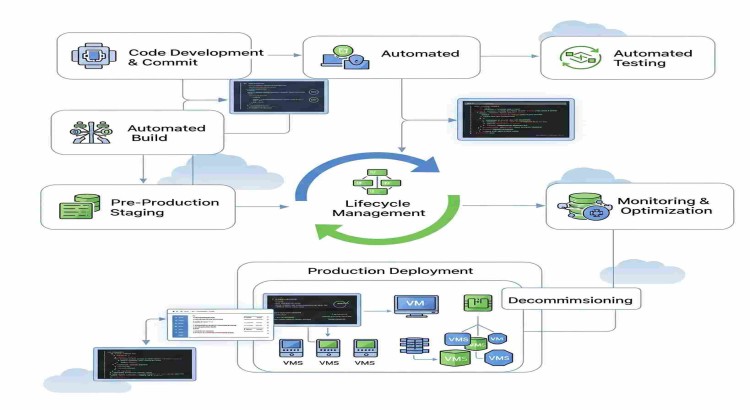
- Git & CI/CD Setup: A new Git repository will be initialized to host the project code. A GitHub Actions workflow will be written to automatically trigger, integrate, and deploy the dashboard on every push to the main branch.
- Deployment: The pipeline will be configured to automatically deploy the dashboard to the chosen cloud platform (Heroku or Vercel) after all tests pass successfully.
- Phase 3: Documentation & Delivery (1-2 days): A comprehensive README.md file will be created. This documentation is a critical deliverable and must be clear, detailed, and professional. It should include:
- A project overview and purpose.
- A list of prerequisites and dependencies.
- Step-by-step instructions on how to set up, configure, and use the solution.
- A troubleshooting section for common issues.
- Visuals, such as screenshots or a GIF, demonstrating the final dashboard and the automated workflow.
- Expected Outcomes: The delivered solution will demonstrate a professional, scalable, and reliable method for managing data dashboards, showcasing the freelancer's expertise in both DevOps and data visualization.
Service Features
- ● Customization & Branding
- ● Ongoing Maintenance & Support
- ● Performance Optimization
- ● Training & Handoff
- ● Advanced Features Integration
About the Seller
From
Auckland Region, New Zealand
Member Since
Oct 2024
Skills:
Basic
Related Services
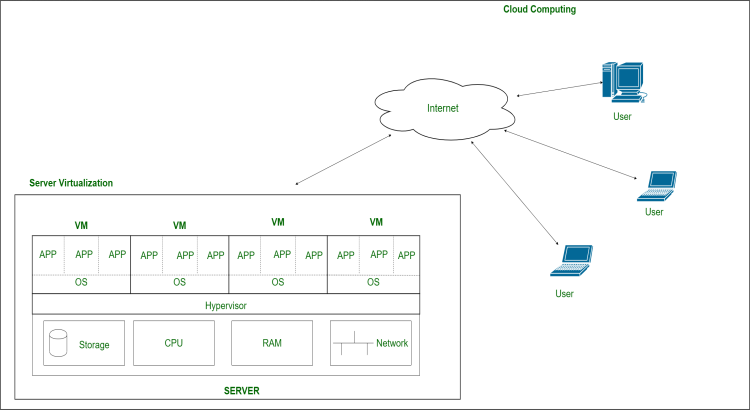
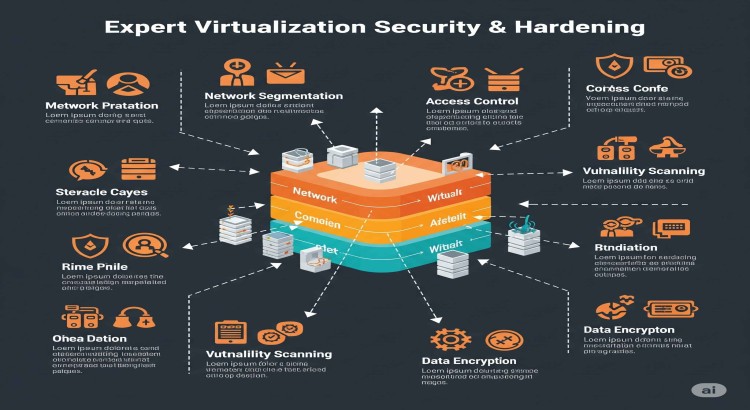
Virtualization
Virtualized server setup and management to reduce costs and enhance flexibility.
Virtualization
Automated Deployment Pipeline & Lifecycle Management for Virtualized Data Centers


Join as a freelancer or client
Join as a Freelancer
Join as a Client